Case No. 13 Data visualization
A 3D bar chart from a list of numbers
Twelve bars, a colour that follows the value, month labels and a title. Change two lists to plot your own data.
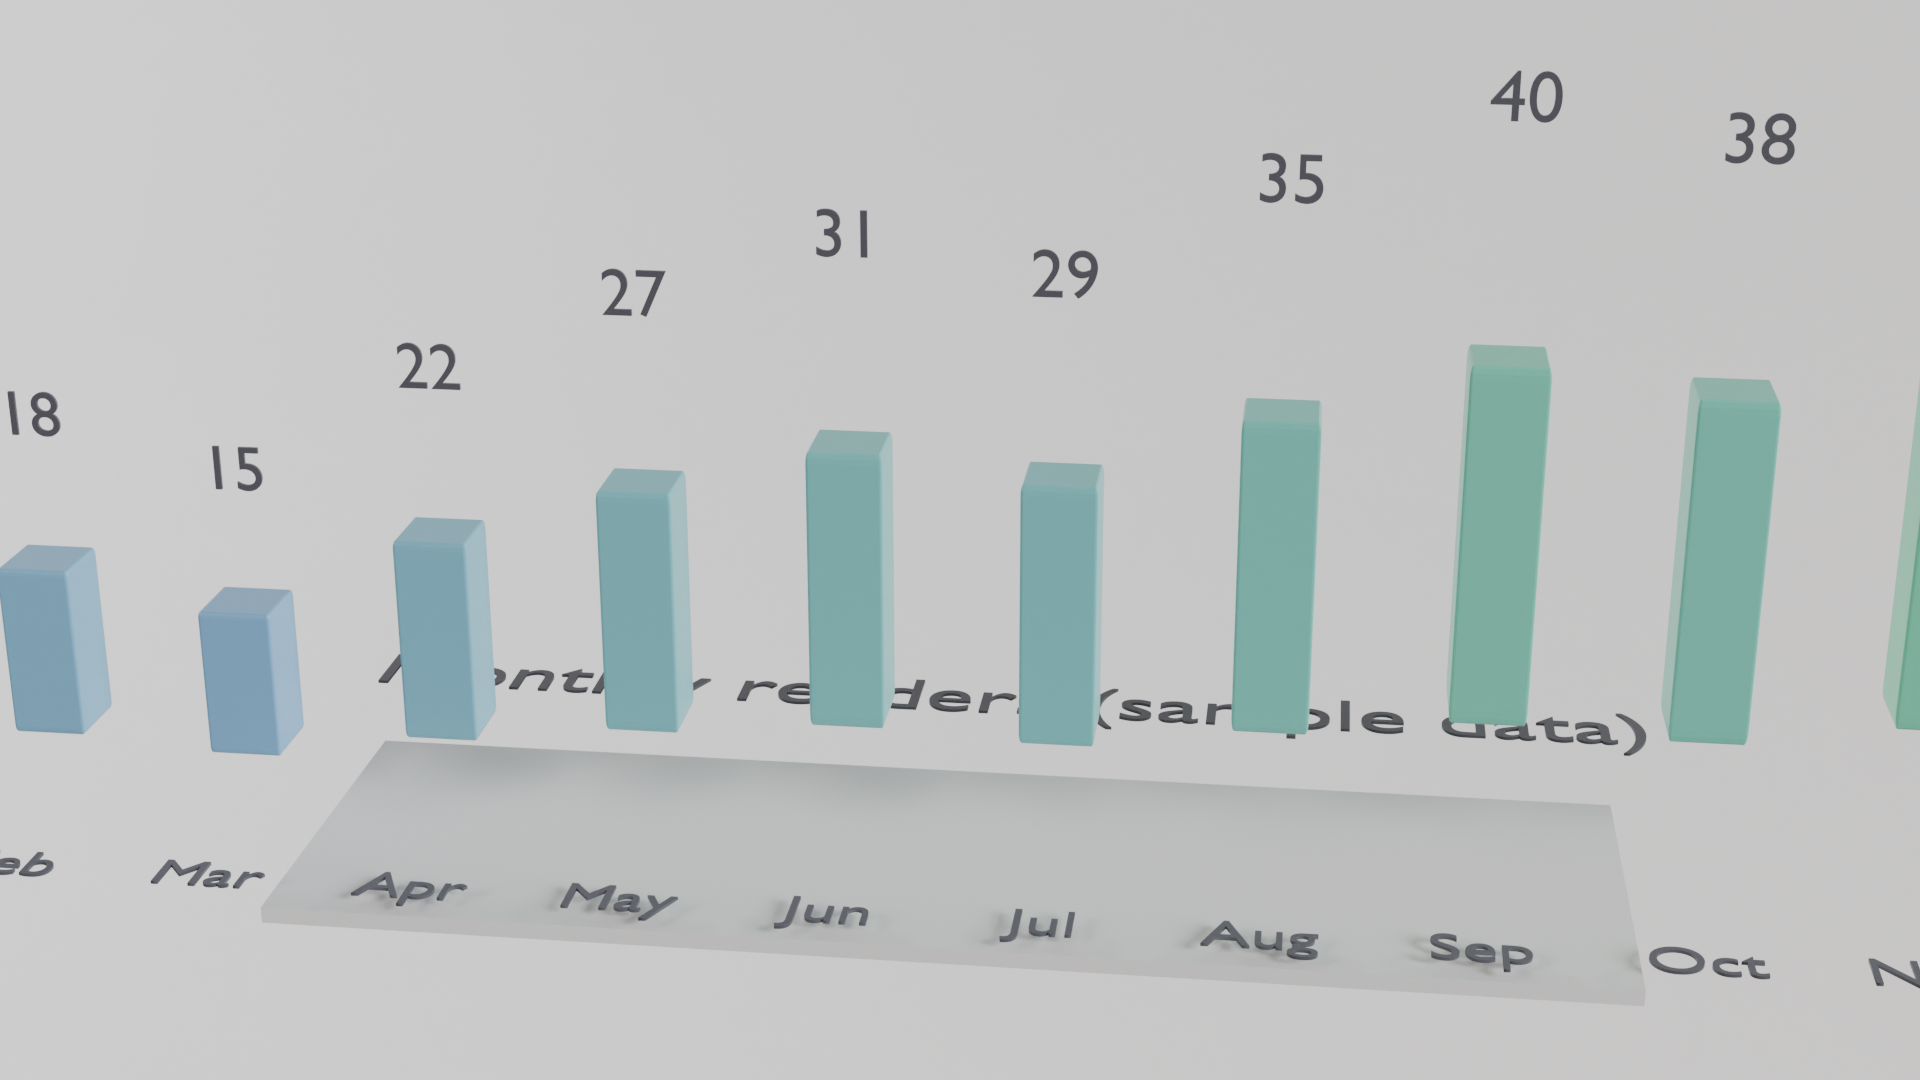
This 3D bar chart with month labels was rendered on a JANCTION GPU from a bpy script that builds twelve bars from a list of values. Bar colour follows the value; changing VALUES and LABELS in the script plots other data. It took 5.9 GPU seconds on the production GPU, 0.6 JPY at 0.1 JPY per GPU-second.
What is in the frame
Twelve bars from January to December, each labelled with its value, lit like a product shot. A rendered chart stands out in a report or a slide where flat charts are the norm.
How the scene is built
Two lists drive everything: VALUES sets the bar heights and LABELS sets the month names. A colour ramp maps value to colour. Labels and the title are text objects.
Adapt it
Paste your numbers into VALUES, or let an agent read them from a CSV and write the lists. The chart re-renders in the same style every month.
0.6 JPY for this render. The free welcome credit of a new key covers about 170 of them, with no card.
Render this example with your AI
ChatGPT · Claude · Grok · Perplexity
Use JANCTION Render (MCP server https://render.janction.jp/mcp) to render this example: render_preview(scene_url="https://render.janction.jp/samples/ex13_bar_chart.py"). Then suggest how to change the colors, shapes and camera for my own subject. Ask me before the final render.
Each link opens the app with the text below filled in (if it is not, copy and paste it). If JANCTION Render is not connected in that app yet, add https://render.janction.jp/mcp as a connector first.
Blender warnings
- environment preset 'studio' replaced the scene's world (HDRI lighting)
The script (bpy, runs as is)
ex13_bar_chart.py. It builds the scene, the camera and the frame range; resolution, samples, denoising and the GPU are set by the service.
"""JANCTION Render example 13: a 3D bar chart with month labels (data visualization, one still).

Reproduce: render_final(scene_url="https://render.janction.jp/samples/ex13_bar_chart.py",
                        width=1920, height=1080, samples=128, environment="studio")
Twelve bars from a list of values, a colour that follows the value, text labels and a title; change
VALUES and LABELS to plot your own numbers.
"""
import math
import random

import bpy
from mathutils import Vector

for ob in list(bpy.data.objects):
    bpy.data.objects.remove(ob, do_unlink=True)
scene = bpy.context.scene
scene.frame_start = 1
scene.frame_end = 1
scene.render.fps = 24
random.seed(13)


def material(name, color, roughness=0.5, metallic=0.0, **inputs):
    mat = bpy.data.materials.new(name)
    mat.use_nodes = True
    bsdf = mat.node_tree.nodes["Principled BSDF"]
    bsdf.inputs["Base Color"].default_value = (*color, 1.0)
    bsdf.inputs["Roughness"].default_value = roughness
    bsdf.inputs["Metallic"].default_value = metallic
    for key, value in inputs.items():
        bsdf.inputs[key].default_value = value
    return mat


def smooth(ob):
    for p in ob.data.polygons:
        p.use_smooth = True
    return ob


def add(op, name, mat=None, **kw):
    getattr(bpy.ops.mesh, op)(**kw)
    ob = bpy.context.object
    ob.name = name
    if mat is not None:
        ob.data.materials.append(mat)
    return ob


def text(body, name, mat, location, size=1.0, extrude=0.02, rotation=(math.pi / 2, 0, 0), align="CENTER"):
    cu = bpy.data.curves.new(name, type="FONT")
    cu.body = body
    cu.size = size
    cu.extrude = extrude
    cu.align_x = align
    ob = bpy.data.objects.new(name, cu)
    scene.collection.objects.link(ob)
    ob.location = location
    ob.rotation_euler = rotation
    ob.data.materials.append(mat)
    return ob


def look_at(ob, target):
    ob.rotation_euler = (Vector(target) - ob.location).to_track_quat("-Z", "Y").to_euler()


def camera(location, target, lens=50.0, name="Camera", active=True, fstop=None, focus=None):
    data = bpy.data.cameras.new(name)
    data.lens = lens
    if fstop is not None:
        data.dof.use_dof = True
        data.dof.aperture_fstop = fstop
        data.dof.focus_distance = focus if focus is not None else (Vector(target) - Vector(location)).length
    cam = bpy.data.objects.new(name, data)
    scene.collection.objects.link(cam)
    cam.location = location
    look_at(cam, target)
    if active:
        scene.camera = cam
    return cam


def light(name, kind, location, energy, target=None, size=1.0, color=(1.0, 1.0, 1.0)):
    data = bpy.data.lights.new(name, kind)
    data.energy = energy
    data.color = color
    if kind == "AREA":
        data.size = size
    ob = bpy.data.objects.new(name, data)
    scene.collection.objects.link(ob)
    ob.location = location
    if target is not None:
        look_at(ob, target)
    return ob


def world(color=(0.02, 0.02, 0.03), strength=1.0):
    w = bpy.data.worlds.new("World")
    w.use_nodes = True
    bg = w.node_tree.nodes["Background"]
    bg.inputs[0].default_value = (*color, 1.0)
    bg.inputs[1].default_value = strength
    scene.world = w
    return w

VALUES = [12, 18, 15, 22, 27, 31, 29, 35, 40, 38, 44, 51]
LABELS = ["Jan", "Feb", "Mar", "Apr", "May", "Jun", "Jul", "Aug", "Sep", "Oct", "Nov", "Dec"]
base = material("Base", (0.92, 0.92, 0.9), roughness=0.6)
ink = material("Ink", (0.1, 0.1, 0.12), roughness=0.5)
plate = add("primitive_cube_add", "Base", base, size=1, location=(0, 0, -0.1))
plate.scale = (8.0, 2.4, 0.1)
vmax = max(VALUES)
for i, (v, lab) in enumerate(zip(VALUES, LABELS)):
    t = v / vmax
    col = (0.15 + 0.1 * (1 - t), 0.35 + 0.45 * t, 0.9 - 0.5 * t)
    m = material(f"Bar{i}", col, roughness=0.35)
    h = 0.4 + 5.0 * t
    x = -6.9 + i * 1.25
    bar = add("primitive_cube_add", f"Bar_{lab}", m, size=1, location=(x, 0, h / 2))
    bar.scale = (0.45, 0.45, h / 2)
    bev = bar.modifiers.new("Bevel", "BEVEL")
    bev.width = 0.04
    bev.segments = 3
    text(lab, f"Label_{lab}", ink, (x, -1.1, 0.02), size=0.42, extrude=0.01, rotation=(0, 0, 0))
    text(str(v), f"Value_{lab}", ink, (x, 0, h + 0.25), size=0.4, extrude=0.01, rotation=(math.pi / 2, 0, 0))
text("Monthly renders (sample data)", "Title", ink, (0, 2.0, 0.02), size=0.7, extrude=0.01, rotation=(0, 0, 0))
camera((2.0, -16.0, 8.0), (0.0, 0.0, 2.0), lens=55)