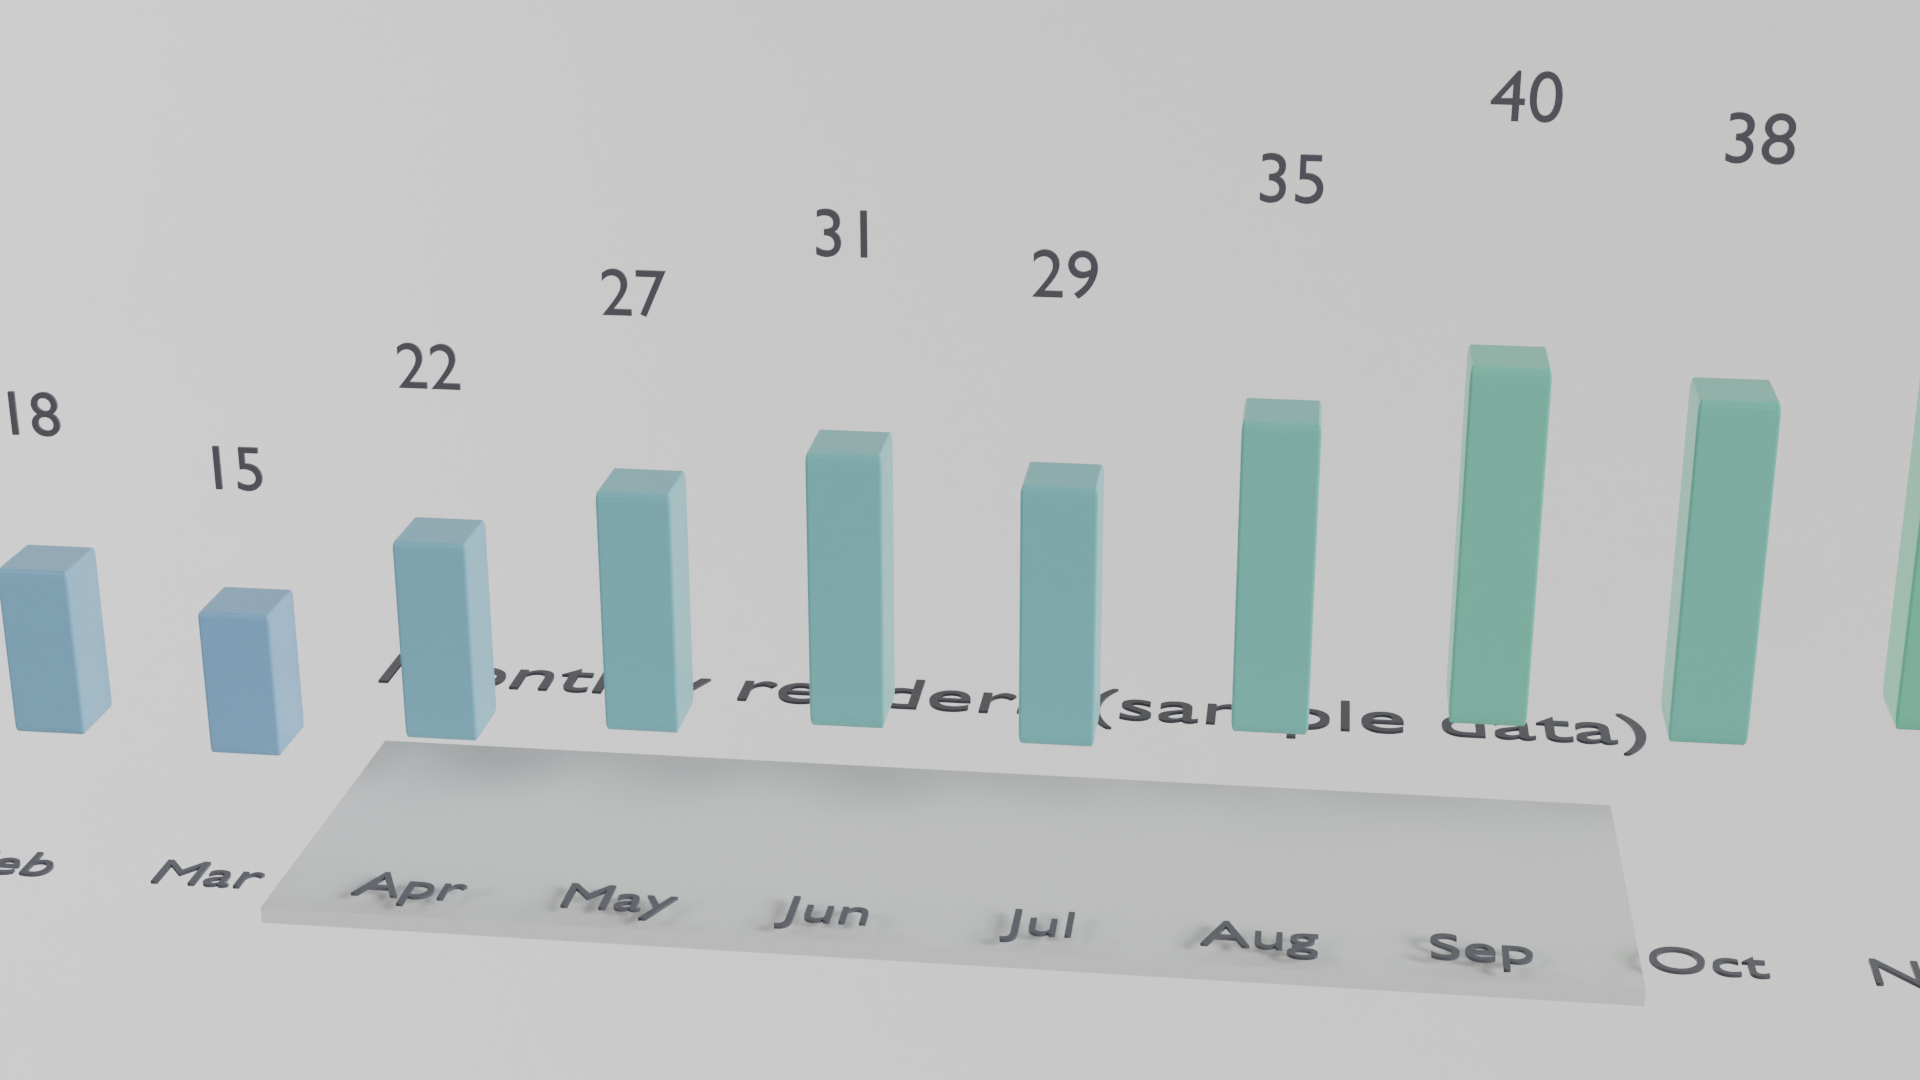
データ可視化: ラベルつきの 3D 棒グラフ。本番の GPU で描いた本物の結果と、そのまま動く bpy スクリプト、設定、GPU 秒。スクリプトの URL を scene_url に渡せば同じものが出ます。
| 頼んだ文 | https://render.janction.jp/samples/ex13_bar_chart.py を studio プリセット、1920x1080、128 サンプルで描いて(VALUES を変えれば自分の数字に)。 |
|---|---|
| MCP の呼び出し | render_final(scene_url="https://render.janction.jp/samples/ex13_bar_chart.py", frame_start=1, frame_end=1, samples=128, output="png", width=1920, height=1080, environment="studio") |
| GPU 秒 / 往復 | 5.9 s / 6 s |
| 料金の目安(予定単価) | 0.6 JPY (ベータ中は 0 円) |
| 描いた日 | 2026-10-08 |
| Blender | 5.0 |
| frame_start | 1 |
|---|---|
| frame_end | 1 |
| samples | 128 |
| denoise | True |
| output | png |
| width | 1920 |
| height | 1080 |
| environment | studio |
ex13_bar_chart.py。シーン・カメラ・コマ範囲だけを組み、解像度・サンプル・ノイズ除去・GPU はサービスが決めます。
"""JANCTION Render example 13: a 3D bar chart with month labels (data visualization, one still).

Reproduce: render_final(scene_url="https://render.janction.jp/samples/ex13_bar_chart.py",
                        width=1920, height=1080, samples=128, environment="studio")
Twelve bars from a list of values, a colour that follows the value, text labels and a title; change
VALUES and LABELS to plot your own numbers.
"""
import math
import random

import bpy
from mathutils import Vector

for ob in list(bpy.data.objects):
    bpy.data.objects.remove(ob, do_unlink=True)
scene = bpy.context.scene
scene.frame_start = 1
scene.frame_end = 1
scene.render.fps = 24
random.seed(13)


def material(name, color, roughness=0.5, metallic=0.0, **inputs):
    mat = bpy.data.materials.new(name)
    mat.use_nodes = True
    bsdf = mat.node_tree.nodes["Principled BSDF"]
    bsdf.inputs["Base Color"].default_value = (*color, 1.0)
    bsdf.inputs["Roughness"].default_value = roughness
    bsdf.inputs["Metallic"].default_value = metallic
    for key, value in inputs.items():
        bsdf.inputs[key].default_value = value
    return mat


def smooth(ob):
    for p in ob.data.polygons:
        p.use_smooth = True
    return ob


def add(op, name, mat=None, **kw):
    getattr(bpy.ops.mesh, op)(**kw)
    ob = bpy.context.object
    ob.name = name
    if mat is not None:
        ob.data.materials.append(mat)
    return ob


def text(body, name, mat, location, size=1.0, extrude=0.02, rotation=(math.pi / 2, 0, 0), align="CENTER"):
    cu = bpy.data.curves.new(name, type="FONT")
    cu.body = body
    cu.size = size
    cu.extrude = extrude
    cu.align_x = align
    ob = bpy.data.objects.new(name, cu)
    scene.collection.objects.link(ob)
    ob.location = location
    ob.rotation_euler = rotation
    ob.data.materials.append(mat)
    return ob


def look_at(ob, target):
    ob.rotation_euler = (Vector(target) - ob.location).to_track_quat("-Z", "Y").to_euler()


def camera(location, target, lens=50.0, name="Camera", active=True, fstop=None, focus=None):
    data = bpy.data.cameras.new(name)
    data.lens = lens
    if fstop is not None:
        data.dof.use_dof = True
        data.dof.aperture_fstop = fstop
        data.dof.focus_distance = focus if focus is not None else (Vector(target) - Vector(location)).length
    cam = bpy.data.objects.new(name, data)
    scene.collection.objects.link(cam)
    cam.location = location
    look_at(cam, target)
    if active:
        scene.camera = cam
    return cam


def light(name, kind, location, energy, target=None, size=1.0, color=(1.0, 1.0, 1.0)):
    data = bpy.data.lights.new(name, kind)
    data.energy = energy
    data.color = color
    if kind == "AREA":
        data.size = size
    ob = bpy.data.objects.new(name, data)
    scene.collection.objects.link(ob)
    ob.location = location
    if target is not None:
        look_at(ob, target)
    return ob


def world(color=(0.02, 0.02, 0.03), strength=1.0):
    w = bpy.data.worlds.new("World")
    w.use_nodes = True
    bg = w.node_tree.nodes["Background"]
    bg.inputs[0].default_value = (*color, 1.0)
    bg.inputs[1].default_value = strength
    scene.world = w
    return w

VALUES = [12, 18, 15, 22, 27, 31, 29, 35, 40, 38, 44, 51]
LABELS = ["Jan", "Feb", "Mar", "Apr", "May", "Jun", "Jul", "Aug", "Sep", "Oct", "Nov", "Dec"]
base = material("Base", (0.92, 0.92, 0.9), roughness=0.6)
ink = material("Ink", (0.1, 0.1, 0.12), roughness=0.5)
plate = add("primitive_cube_add", "Base", base, size=1, location=(0, 0, -0.1))
plate.scale = (8.0, 2.4, 0.1)
vmax = max(VALUES)
for i, (v, lab) in enumerate(zip(VALUES, LABELS)):
    t = v / vmax
    col = (0.15 + 0.1 * (1 - t), 0.35 + 0.45 * t, 0.9 - 0.5 * t)
    m = material(f"Bar{i}", col, roughness=0.35)
    h = 0.4 + 5.0 * t
    x = -6.9 + i * 1.25
    bar = add("primitive_cube_add", f"Bar_{lab}", m, size=1, location=(x, 0, h / 2))
    bar.scale = (0.45, 0.45, h / 2)
    bev = bar.modifiers.new("Bevel", "BEVEL")
    bev.width = 0.04
    bev.segments = 3
    text(lab, f"Label_{lab}", ink, (x, -1.1, 0.02), size=0.42, extrude=0.01, rotation=(0, 0, 0))
    text(str(v), f"Value_{lab}", ink, (x, 0, h + 0.25), size=0.4, extrude=0.01, rotation=(math.pi / 2, 0, 0))
text("Monthly renders (sample data)", "Title", ink, (0, 2.0, 0.02), size=0.7, extrude=0.01, rotation=(0, 0, 0))
camera((2.0, -16.0, 8.0), (0.0, 0.0, 2.0), lens=55)
JANCTION Render v0.4.21 · JasmyLab Inc. · 更新 2026-10-07 · 検証 Blender 5.0, JANCTION Render 0.4.21 · English